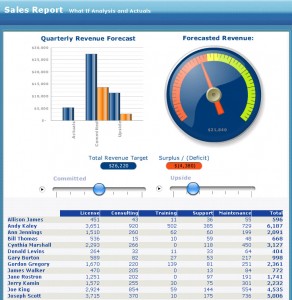
One of the most crucial tasks in management process is reporting. Reporting can be defined as means of communicating data and information. To perform a well comprehend reporting task, one should use a tool/software that give rich set of tools that can be used to design and present reports efficiently. One of the leading brands you should try is Crystal Reports.
If you new to Crystal Reports, this article will provide you with step by step instructions on how to use Crystal Reports:
- Get and install Crystal Reports from SeekDotNet. Make sure that your PC meets the minimum system requirements.
- In the ‘Quick Start’ section you can learn about the process of connecting and retrieving data from a data source, different ways to present data and how to print reports. There is a sample exercise so you can practice creating sample reports.
- After you choose Crystal Reports from the Start menu, it opens to the Start Page with three drop-down menus across the top: File, View and Help. In the body of the page, it gives you choices to either start a new report or open recent reports. If you choose to start a new report, you have several options. You can either design your own report from scratch using a blank report or you can use one of several wizards. It will be easiest to start with the report wizard.
- Specify what kind of information you need and who needs your report. Limit the information to only what’s really important so you will have much clearer report.
- When you select report wizard, a window opens up that helps you connect to your database. If your database is not listed under existing connections, you’ll have to create a new connection to it. You’ll need to tell it what kind of database you’re connecting to. Your simplest starting point is to select an Access/DAO database. A window will open that asks for the database name. If you don’t know the name, click the ellipsis […] next to “database name”, to browse. The wizard will walk you through selecting your tables and fields. Make your first report without using grouping. When you get to the record selection window, you can narrow down your data, adding fields into the filter fields section, then using the drop-downs below to specify what data you do and don’t want.
- When you finish filtering and click Finish, Crystal Reports will select your data and display it to you on the Preview tab. Click the Design tab. You can add headers and footers in here, change their appearance and change the size and name of columns. You have three tool bars at the top of your window. In the lowest one down, the leftmost section is the one that lets you insert text objects, images, charts and such. If you’re familiar with MS Office or its competitors, the choices will be pretty intuitive.
- Under the File menu, you can print your report or export it to other applications such as Word and Excel or as a PDF. You can make it editable or read only. You can export your data into a flat file if that’s what you need. Using the print option, you can send your report out as a fax. Export options also let you send your report directly to one of several email applications.
 Windows Hosting Blog – Seekdotnet.com Blog about Windows Hosting and ASP.NET Hosting